menu close
Introducing Tape D™ Data.

Stay Ahead of the Private Markets

Unparalleled transparency into price factors driving valuations.
Comprehensive data insights powered by Nasdaq Private Market.
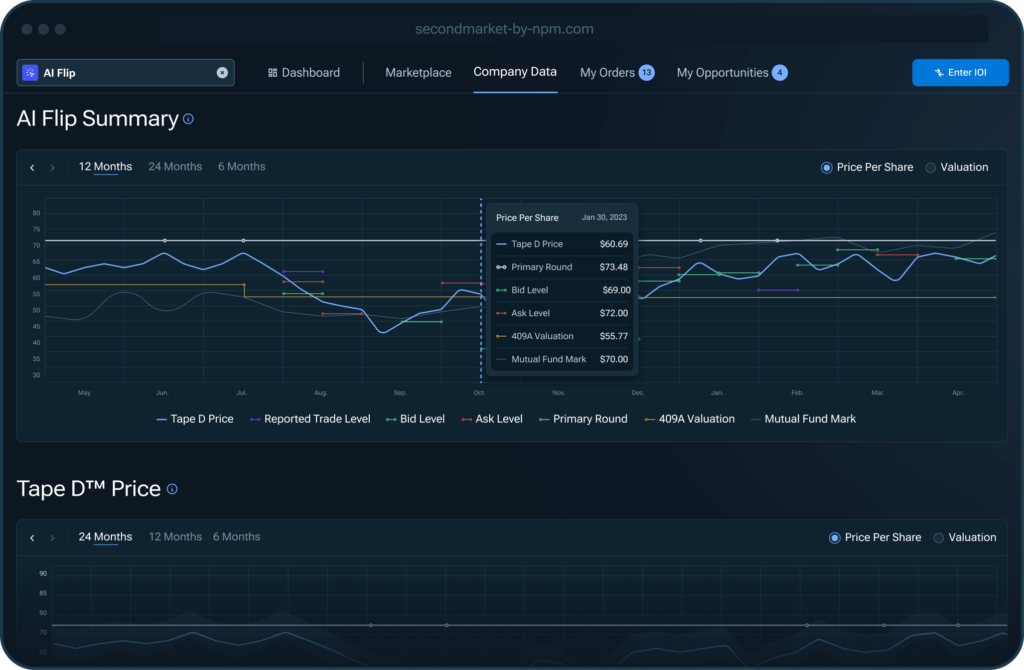
AI Flip summary dashboard with price per share data, trade levels, and valuations across 12 months
UNLOCK PREMIUM ACCESS.

Turn on the Power of Premium Access. Free Trial Today.

Diligence companies and monitor pricing using a comprehensive dataset on Tape D™.

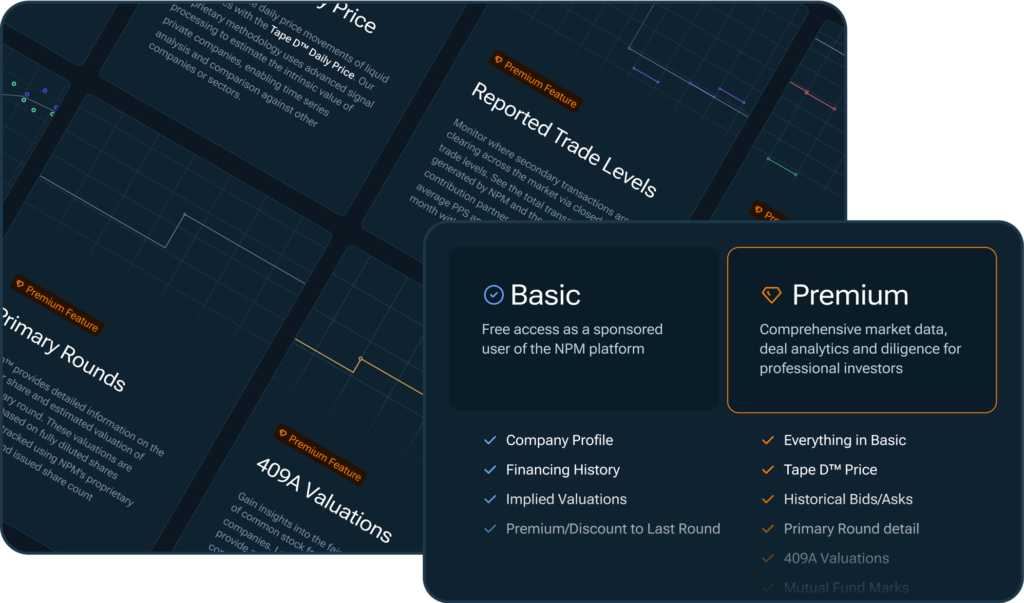
Nasdaq Private Market premium and basic plan comparison
What is Tape D™?

Data Built for Today’s Secondary Market Investors

sell
4K+ Companies Tracked

Firmographic data on venture-backed private companies.

real_estate_agent
175K+ Pages of Filings

Financing data sourced from publicly available company filings.

conversion_path
2K+ Price Histories

Proprietary company share price data generated algorithmically.

settings_alert
1.7M+ Deal Terms

Cap table and fundraising deal terms extracted into structured data.

Request a Free Trial of Tape D Premium Data

Key Components of Tape D Pricing

tune
Tape D Daily Price

Access real-time estimated prices and daily price histories for the most actively-traded names.

Price_check
Reported Trade Levels

Source monthly aggregated closed trade data through SecondMarket and NPM’s data contribution network.

schedule
Bid + Offer History

Track historical market order indications aggregated across the NPM network of investors and brokers.

visibility
Primary Rounds

View detailed round information and estimated valuation using NPM’s proprietary methodology.

memory
409A Valuations

Gain insights into fair market value of common stock based on accounting disclosures.

Sim_card_download
Mutual Fund Marks

Search mutual funds or company names to mark-to-market specific to each share class.

PRICING MODULE.

Tape D Price Components

Tape D Daily Price

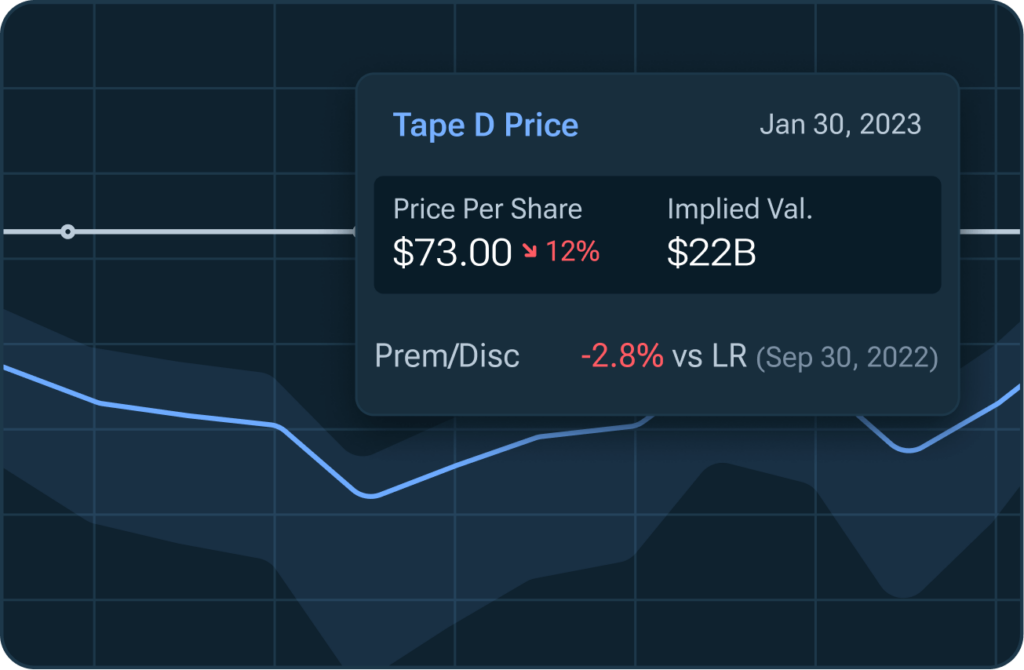
Understand the daily price movements of liquid companies with the Tape D™ Daily Price. Our proprietary methodology uses advanced signal processing to estimate the intrinsic value of private companies, enabling time series analysis and comparison against other companies or sectors.

Tape D price chart with tooltip showing price per share at $73.00, implied valuation $22B, and 12% decrease

Reported Trade Levels

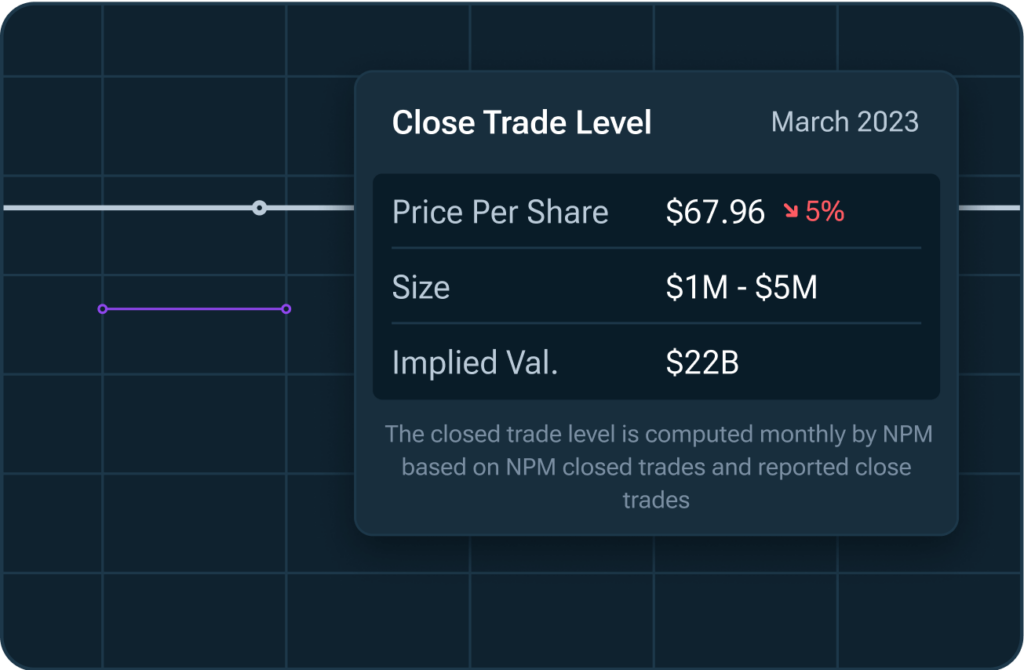
Monitor where secondary transactions are clearing across the market via closed trade levels. See the total transaction volume generated by NPM and the company’s data contribution partner network, along with the average PPS and implied valuation for each month with activity.

Close trade level chart showing price per share at $67.96, implied valuation $22B as of March 2023

Bid + Offer History

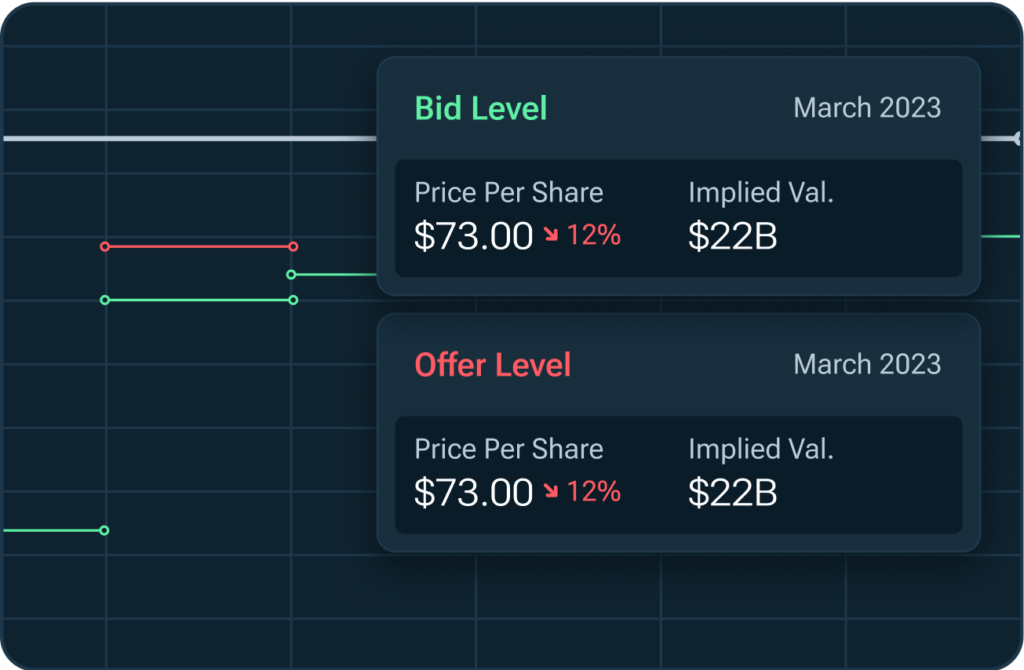
See where the secondary market is valuing private company shares based on over 6,000 historical buy and sell indications collected by NPM and the company’s network of institutional brokers, banks and investors. Track market activity, bid/ask spreads, and whether implied valuations are a premium (or discount) to the last primary round.

Bid and offer levels chart with March 2023 tooltip showing price per share at $73.00 and implied valuation at $22 billion

Primary Rounds

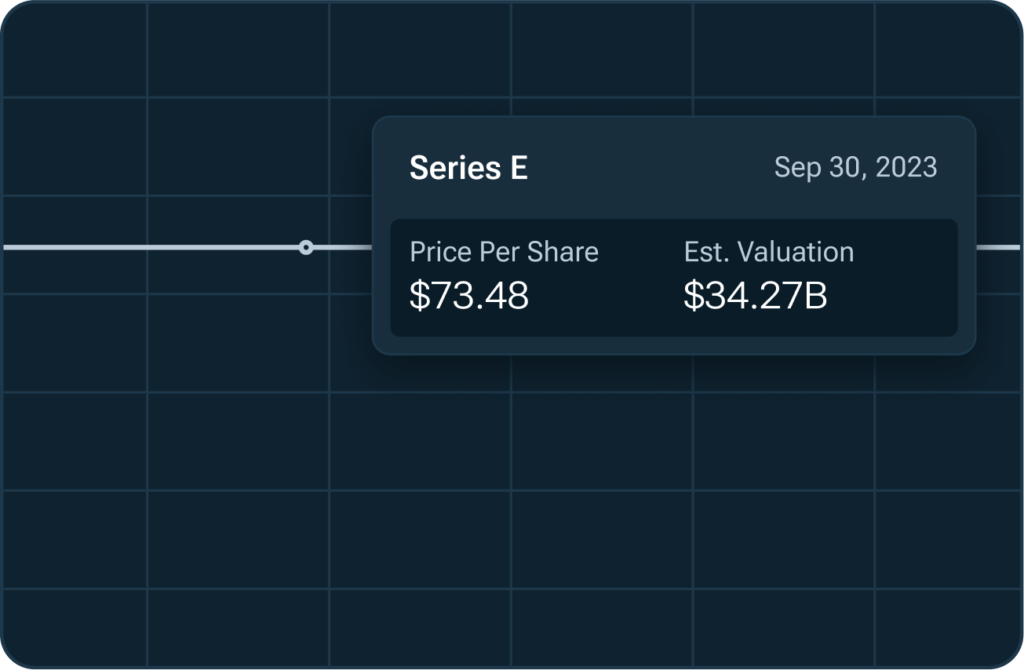
Tape D™ provides detailed information on the price per share and estimated valuation of each primary round. These valuations are calculated based on fully diluted shares outstanding, tracked using NPM’s proprietary methodology and issued share count estimates.

Series E valuation tooltip showing price per share at $73.48 and estimated valuation of $34.27 billion

409A Valuations

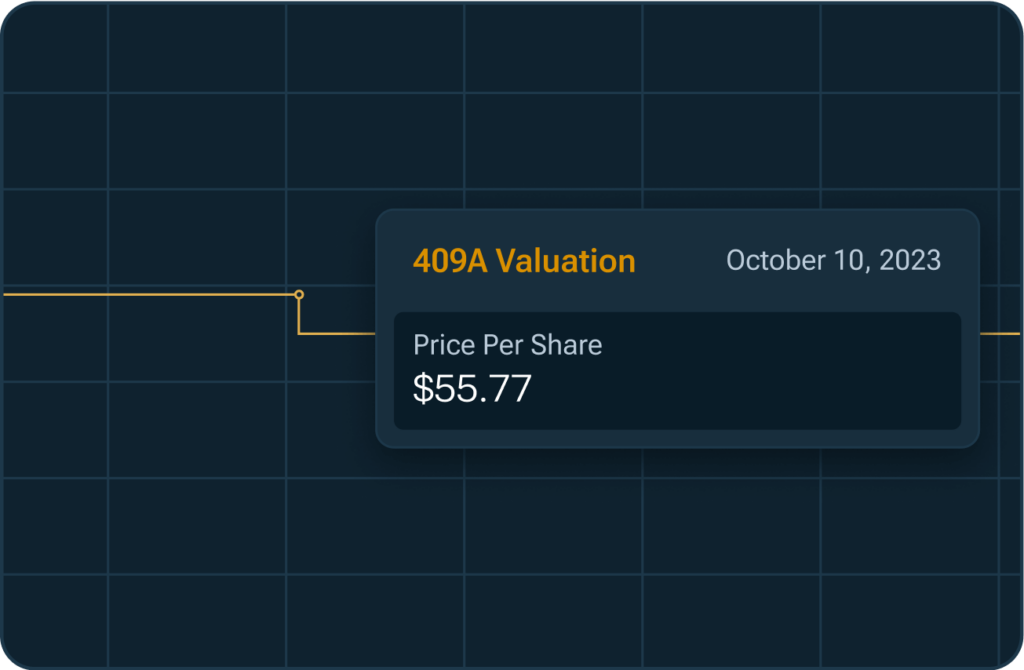
Gain insights into the fair market value (FMV) of common stock for over 4,000 private companies. Leverages reported data to provide a clear view of whether the FMV of common stock is increasing or decreasing. This valuable information helps you stay informed about market trends and make data-driven investment decisions.

409A valuation chart showing $55.77 price per share as of October 10, 2023

Mutual Fund Marks

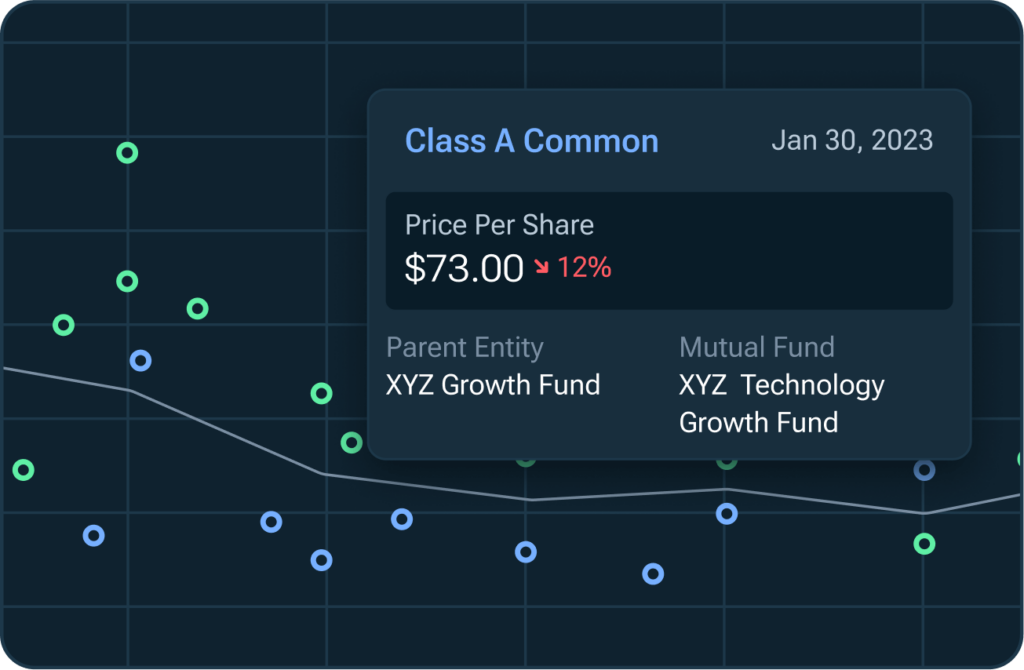
Tape D™ makes it simple to see how mutual funds mark the value of their private stock, leveraging data reported to the SEC. With over 20,000 marks collected from hundreds of private funds, you can easily filter by specific parent entities or time period and understand distinctions between how common and preferred stock are valued.

Class A common stock graph with price per share tooltip highlighting $73.00 with 12% drop, parent and mutual fund details

Who Benefits from Tape D?

Request Access east
Trending_Up
Venture Capitalists

Leverage daily pricing estimates that provide transparency between primary rounds, ensuring accurate portfolio marks, supported by secondary activity and valuation data.

Assured_Workload
Asset Managers

Access scenario-based waterfall analysis to evaluate exit outcomes and shareholder distributions using filings data, including share count, liquidation preference and participation rights.

analytics
Secondary Investors

View aggregated bid+offer pricing and transaction data to assess how their orders against compare to market activity, helping identify liquidity and opportunities in private assets.

Financing History

Track the financing history of private companies through detailed Form D filings with Edgar. Get key insights into PPS, amounts raised, total capital raised over time, and estimated valuation history, offering a transparent look into a company’s funding journey.
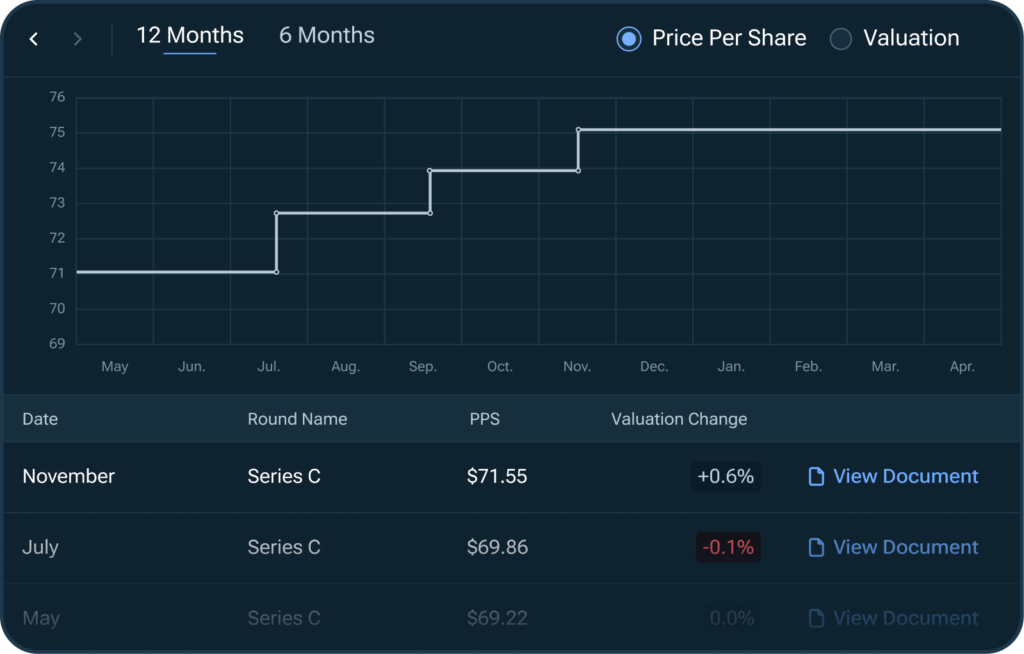
12-month price per share chart for Series C with valuation changes and detailed data table

Pricing Data

Gain unmatched visibility into the price history of private companies with data from multiple sources, including NPM’s Tape D™ Price, reported closed trades, bid/offer orders, 409a valuations, mutual fund marks, and other important pricing indicators.
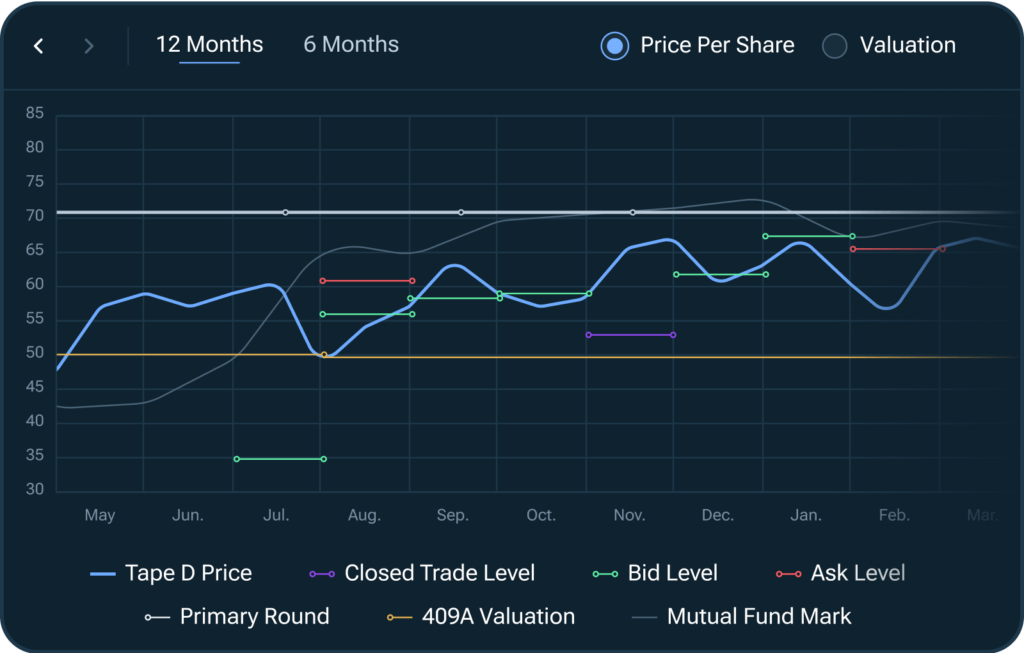
12-month price per share and valuation trends graph with markers for trade levels, primary round, and mutual fund marks

Waterfall Analysis

Evaluate different share classes and their distribution prices per share with our advanced Waterfall Analysis. Explore breakpoints based on various exit values and uncover how each unique capital structure impacts shareholder returns.
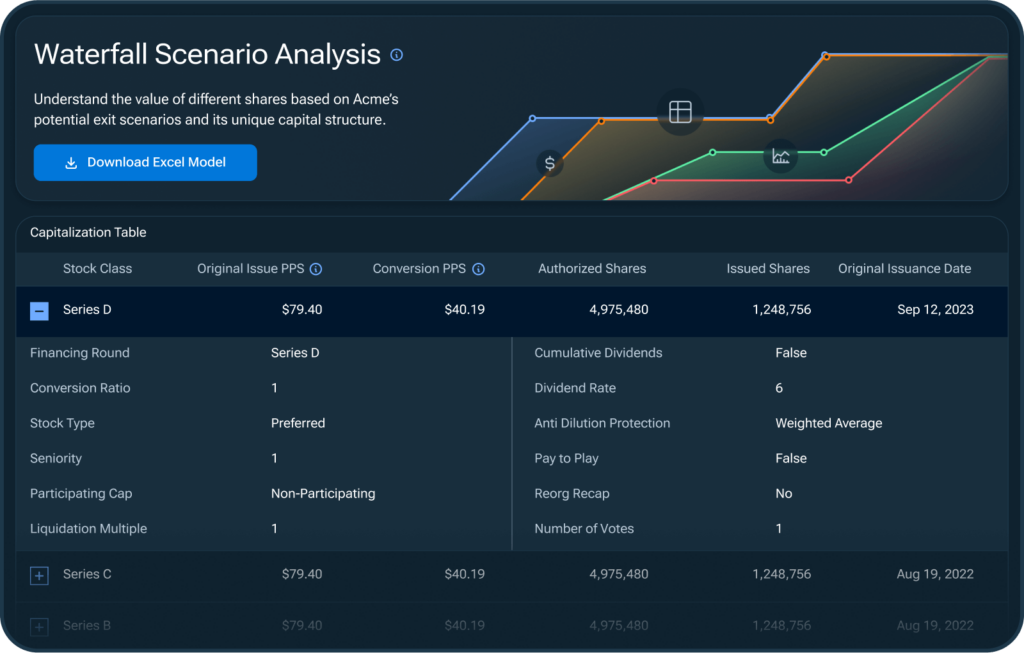
Waterfall scenario analysis dashboard with a graph and capitalization table highlighting Series stock details

Portfolio Analysis

Analyze your portfolio’s performance over time. Compare your cost basis to current fund marks and see how other investors are valuing their positions to assess your portfolio’s standing.
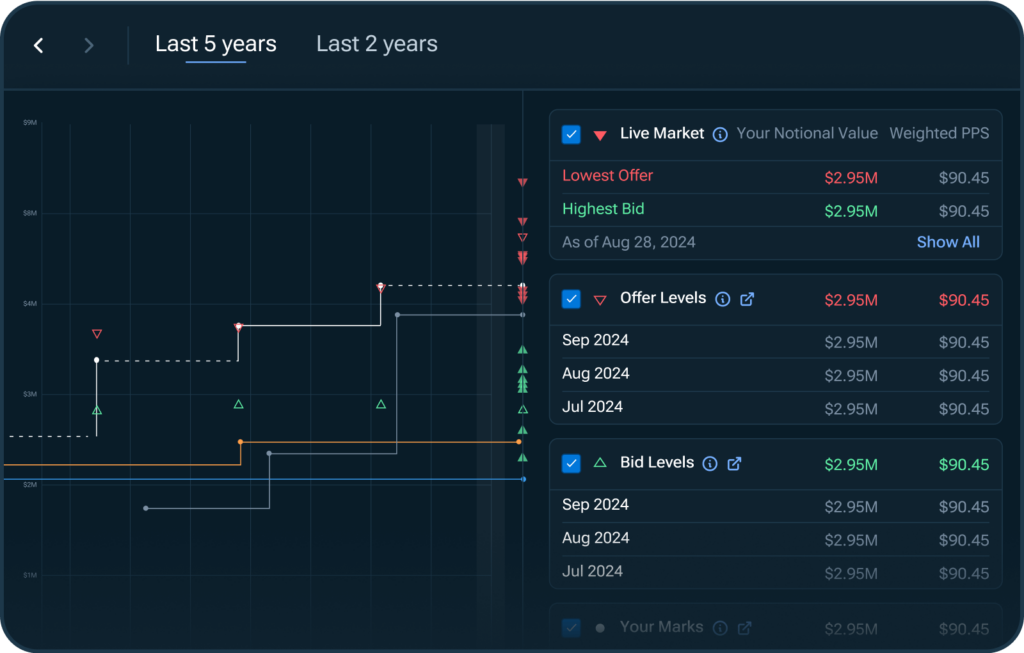
Market activity chart showing bid and offer levels for the last 5 years, with detailed live market data on the side

Source Documents

Access a comprehensive library of crucial regulatory filings, including COIs, EPENs, LOENs, annual reports, and more. Leverage hard-to-source documents to make more informed investment decisions.
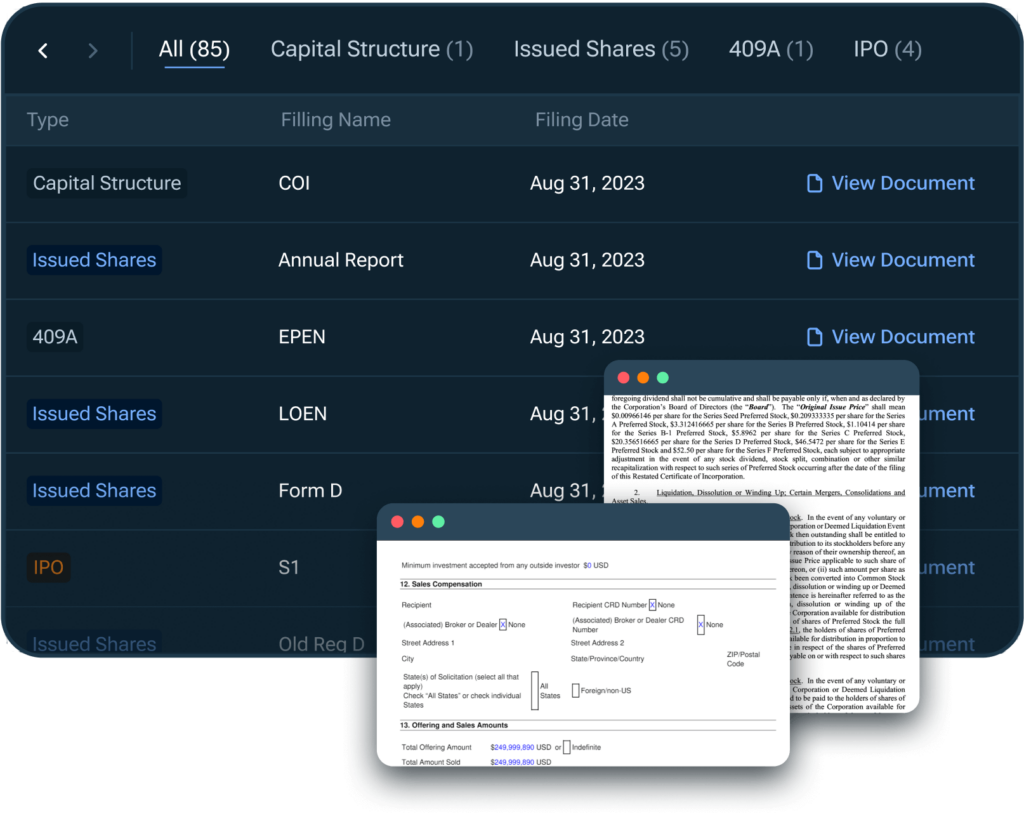
Dashboard displaying capital structure and issued shares with document previews
DATA PRIVACY

Your Data Privacy + Protection is Paramount

Your Consent is Required

At NPM, we prioritize your data privacy and protection. We never share your personal information without your explicit consent.

Secure Environment

Data is anonymized and aggregated for privacy, and we employ state-of-the art technology to secure data within our systems.